
Enterprise Workforce Reporting
From Fragmented Workforce Reports to One Trusted View Across HR & Finance
Challenge | Approach | Solution | Financial Performance | Outcome
A large enterprise relied on multiple Excel-based workforce reports prepared independently by HR and Commercial Finance. Although the underlying information originated from the organisation’s central data environment, each team applied different definitions, calculations and processing methodologies. This resulted in conflicting figures for critical measures such as Headcount and FTE, particularly during month-end reporting. Senior stakeholders could therefore receive different answers depending on which report they were reviewing.
The Challenge
The issue was not simply the reliance on Excel. The more significant problem was that different parts of the organisation were interpreting the same workforce data differently. HR and Commercial Finance had developed separate reporting processes over time, creating differences in metric definitions, calculation methodologies and reporting outputs. This created uncertainty around questions that should have had straightforward answers:
- How many employees do we have?
- What is our actual FTE?
- How is the workforce changing?
- Where are workforce costs concentrated?
- How effectively is investment in people translating into business performance?
Before a new reporting solution could be developed, the underlying definitions and calculation methodologies first needed to be aligned.
Our Approach
The first priority was reporting governance and metric alignment, not immediately building a new dashboard. The engagement included:
- Reviewing existing workforce reports and calculation methodologies across HR and Commercial Finance.
- Identifying differences in the treatment of Headcount, FTE and other workforce measures.
- Agreeing common definitions, calculation methodologies and reporting rules with stakeholders.
- Establishing a consistent reporting framework across both functions.
- Building a Power BI reporting environment based on the agreed framework.
The result was a shared workforce reporting solution that gave HR and Finance a consistent view of the organisation.
Workforce Composition & Organisational Drill-Down
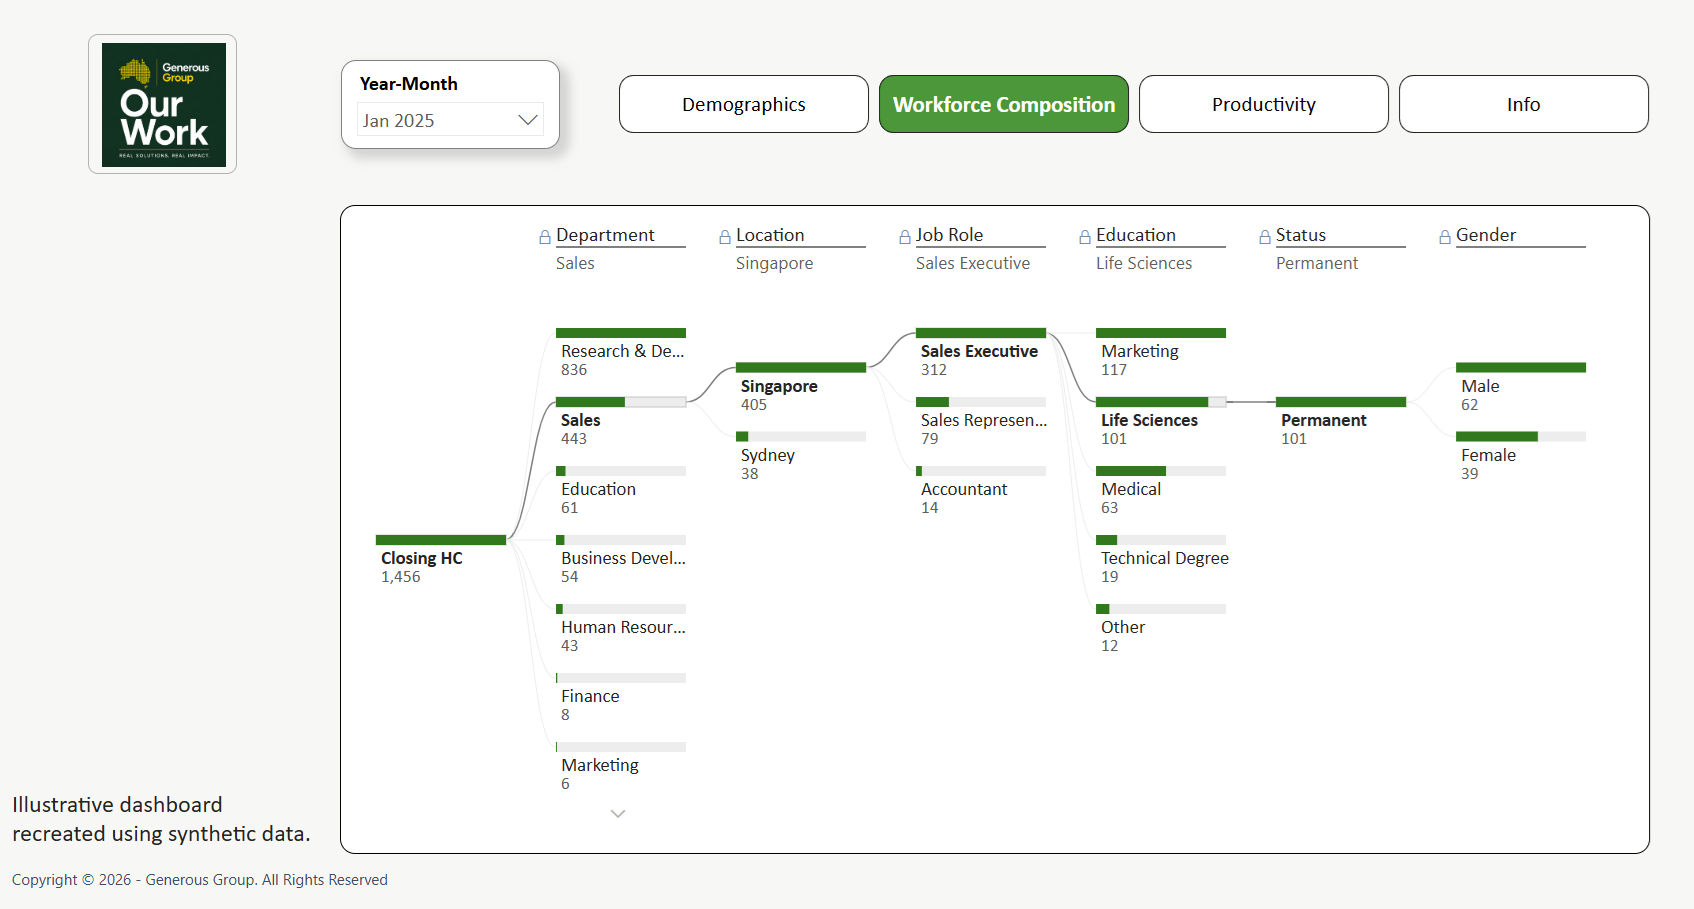
The solution provided an enterprise-level view of workforce composition while allowing users to progressively drill into specific areas of the organisation. Workforce information could be explored by department, location, role, gender, employment status and other organisational dimensions, allowing users to move from a single enterprise Headcount figure to the specific areas contributing to that result.
Illustrative recreation of the reporting solution using synthetic data. No confidential client information is shown.
Workforce Movement & Headcount Reporting
The reporting framework provided a consistent monthly view of workforce movement, reconciling opening Headcount and FTE with new starters, leavers and other movements to arrive at closing workforce numbers. Management could review movements at enterprise level and drill into individual functions and organisational areas, replacing independently prepared reports with a consistent monthly methodology.
Connecting Workforce Data With Financial Performance
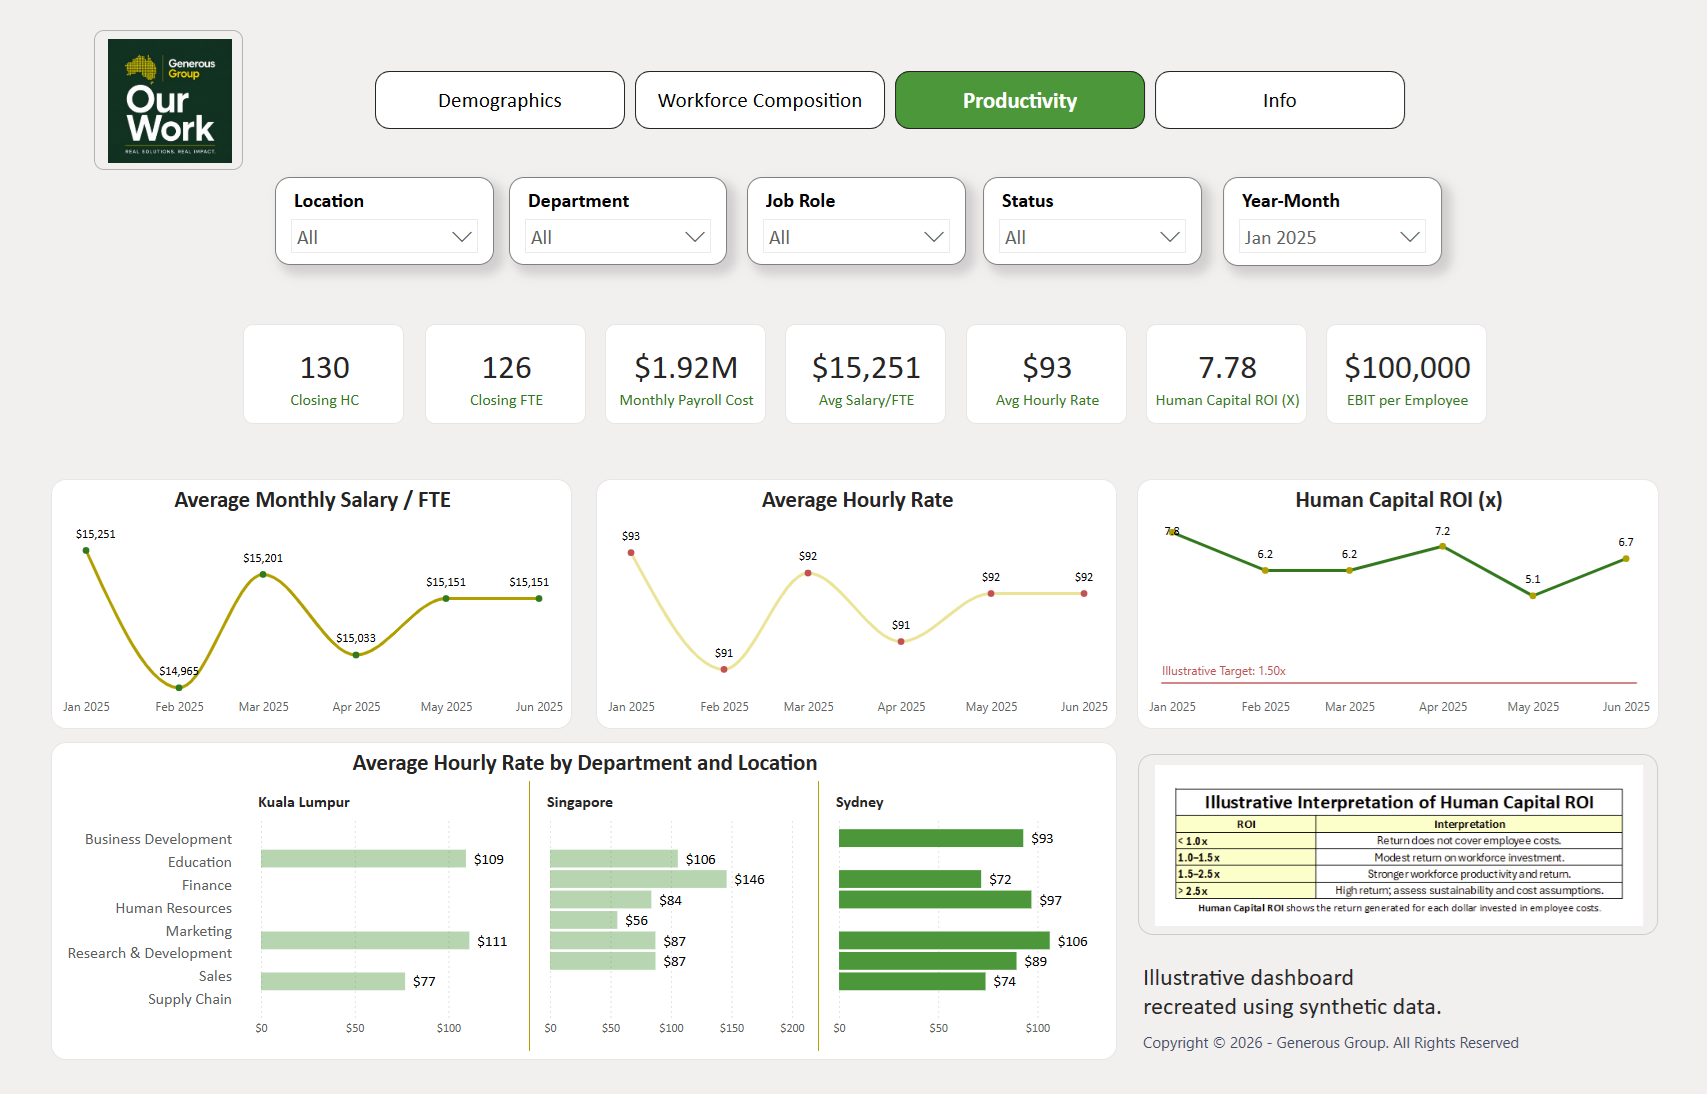
The solution extended beyond traditional HR reporting. Workforce information was combined with financial measures to provide management with greater visibility over the cost, productivity and return associated with its workforce. Measures included Headcount, FTE, payroll cost, average employee cost, average hourly rate, EBIT per employee and Human Capital Return on Investment. This created a more commercially relevant view of workforce performance and enabled HR and Finance stakeholders to analyse people-related decisions within the broader context of business performance.
The Outcome
The organisation moved from fragmented workforce reporting to a shared enterprise reporting framework based on agreed definitions and calculation methodologies. HR and Commercial Finance could work from consistent workforce measures rather than independently prepared numbers. The Power BI solution provided authorised stakeholders with interactive access to workforce composition, movement, cost and productivity information and became part of the organisation’s ongoing monthly reporting process.
Trusted metrics before better reporting.
By aligning definitions first and technology second, workforce information became more consistent, transparent and useful for decision-making.
What This Case Demonstrates
- Reporting Governance
Establishing common definitions and calculation methodologies across functions. - Enterprise Workforce Analytics
Moving from fragmented reporting to an integrated organisation-wide view. - HR & Finance Alignment
Creating workforce measures that both functions can consistently use. - Power BI Reporting
Providing interactive analysis without relying on multiple independently maintained spreadsheets. - Commercial Workforce Insights
Connecting workforce cost and structure with productivity and business performance.
Facing Similar Workforce Reporting Challenges?
If HR, Finance and management are working with different workforce numbers, or significant time is being spent reconciling reports each month, the issue may go deeper than dashboard design. Generous Group can help establish the definitions, analytical framework and reporting needed to create a trusted view of workforce performance.