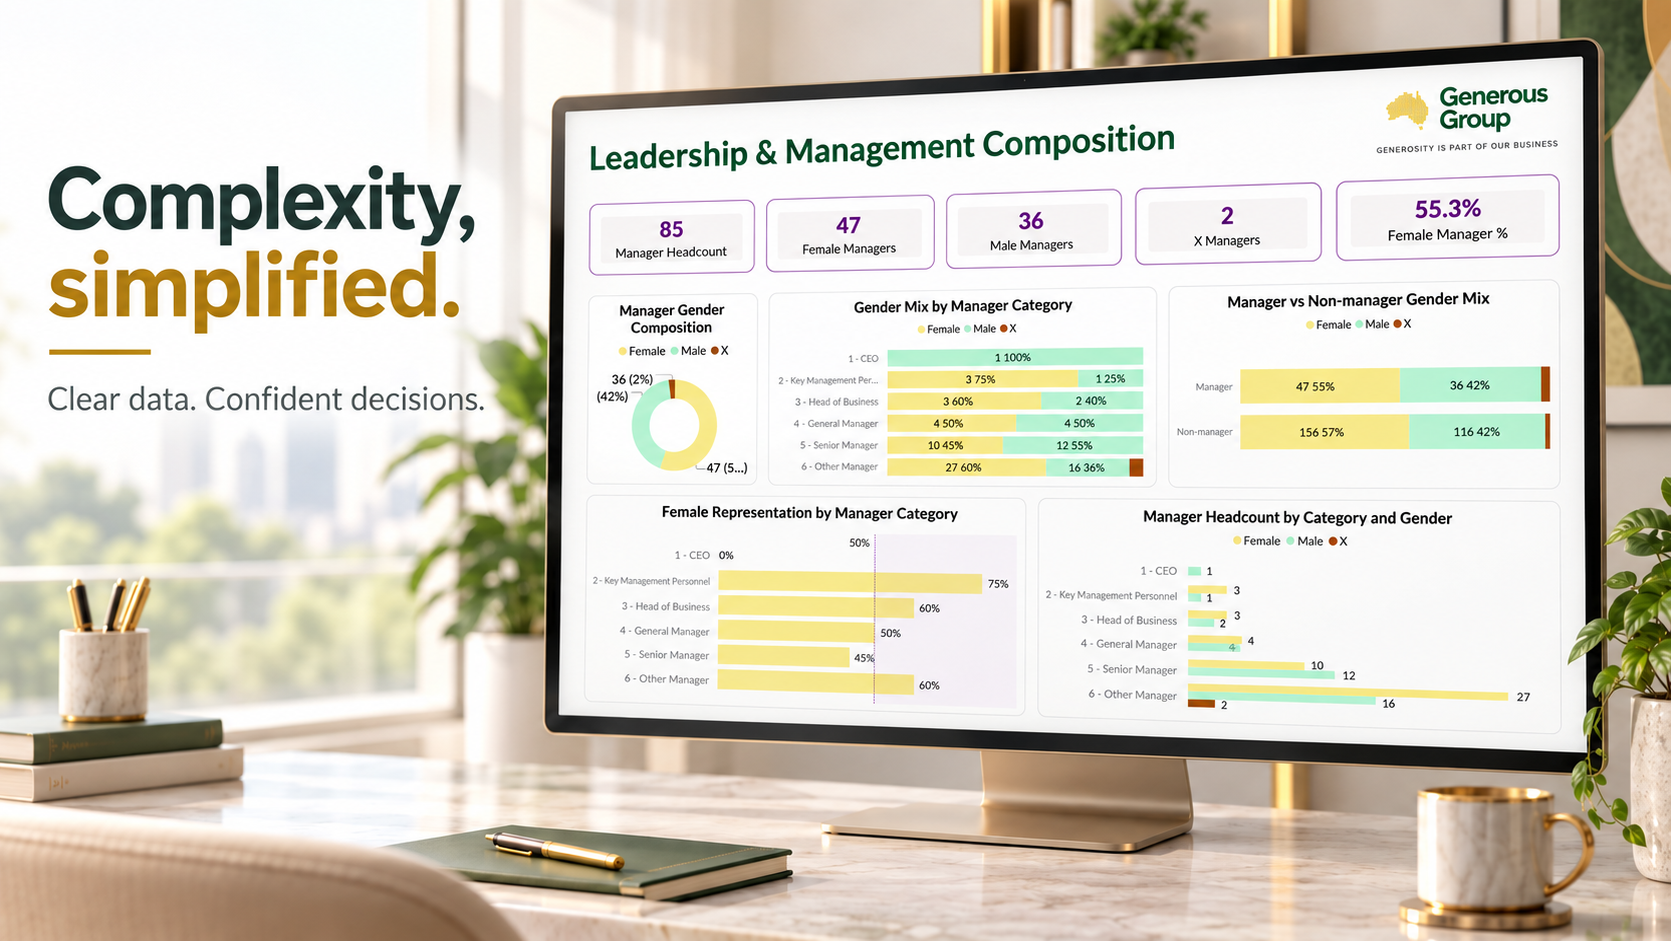
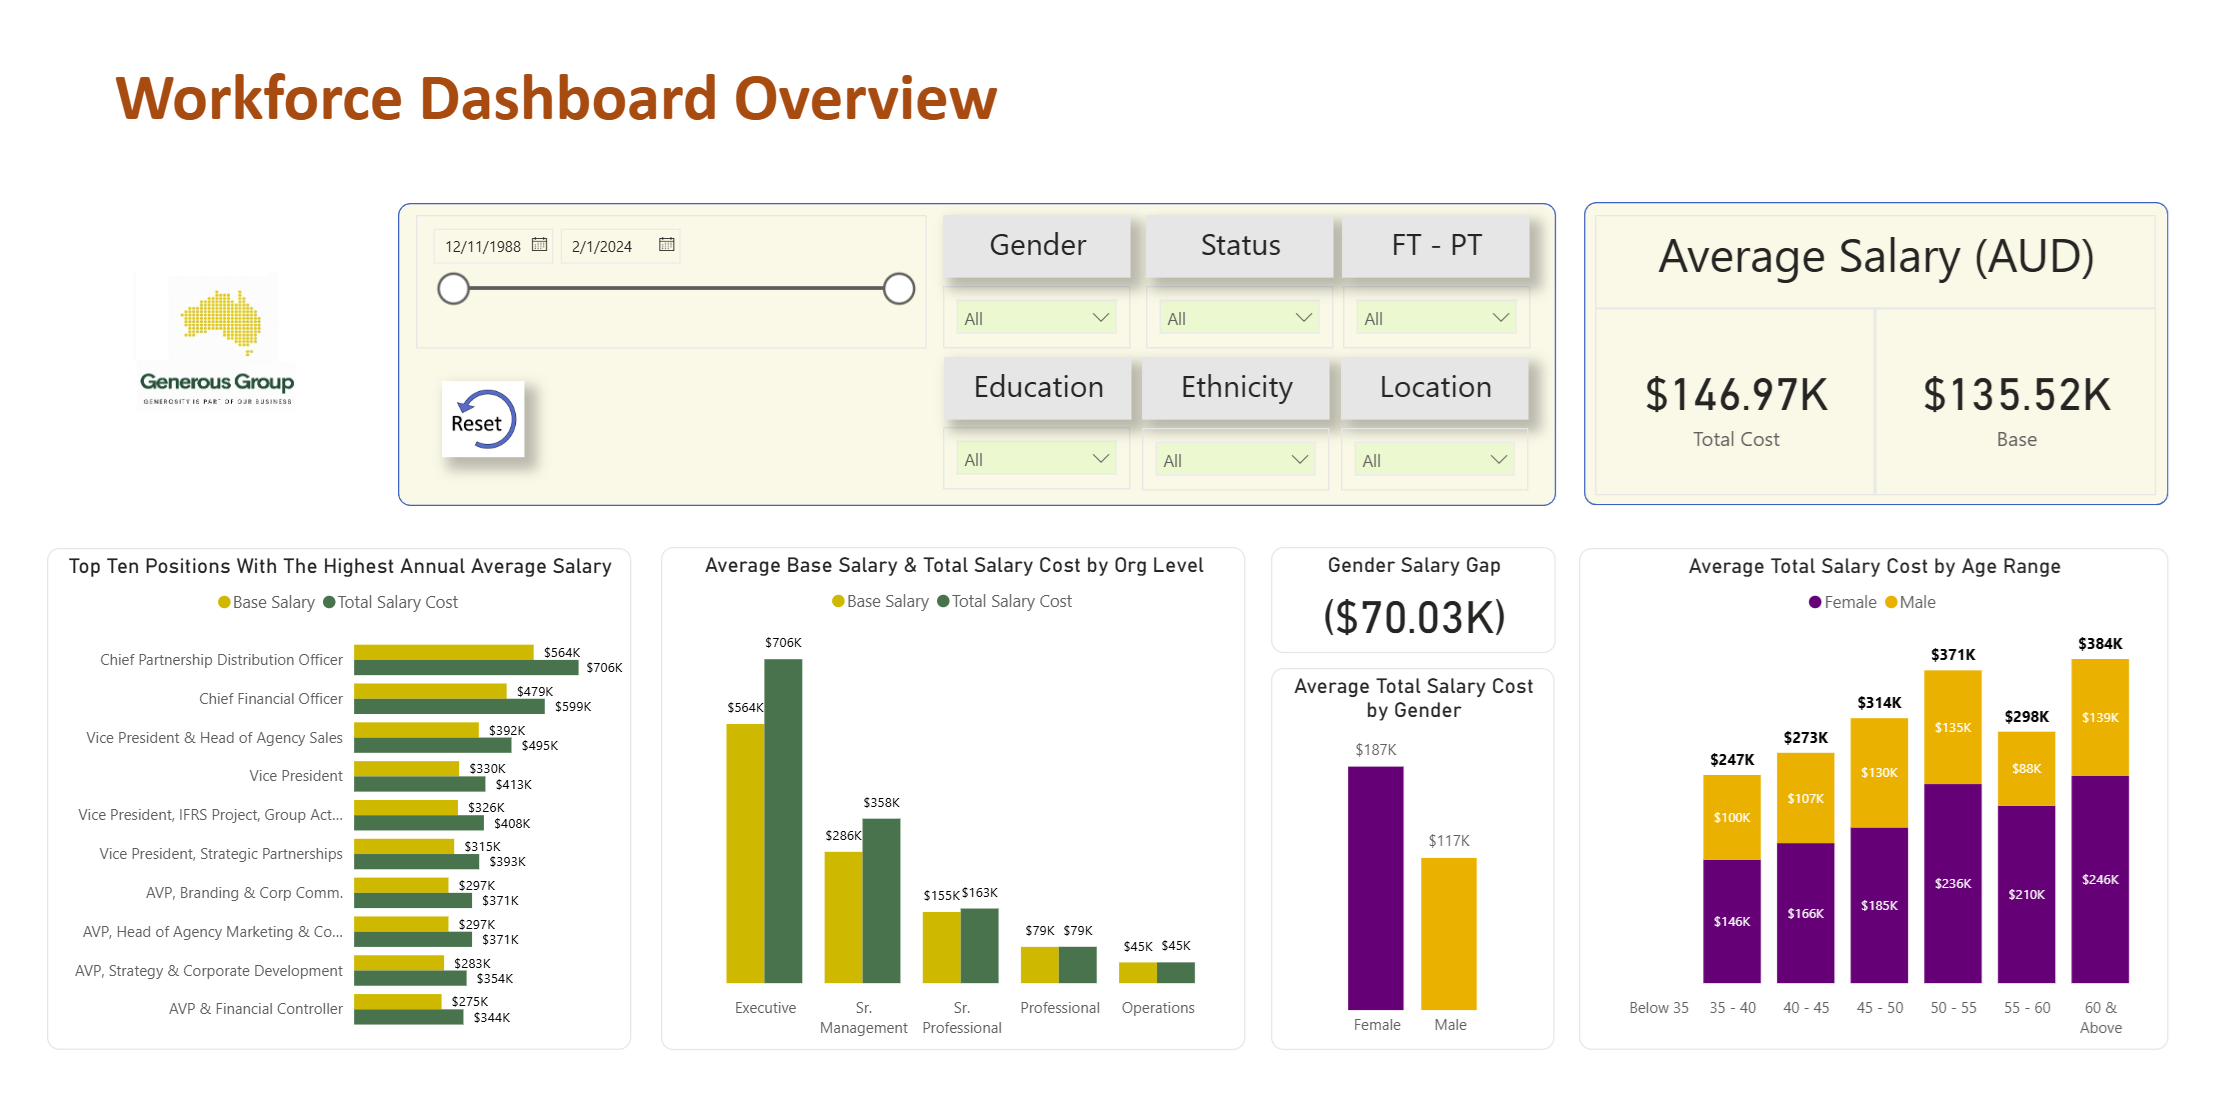
Power BI Dashboards Does this sound familiar? Margin is slipping before anyone notices.Costs exceed budget without an early warning.Sales or operational performance deteriorates between reporting cycles.Problems become visible only after month-end.Too much reporting makes the important exceptions easy to miss.Clear, intuitive dashboards turn business data into actionable insight. What should a good dashboard tell you? Where performance is moving off trackWhich variances are commercially significantWhich trends are improving or deterioratingWhat needs management attention nowDetect Earlier → Understand Faster → Act Sooner How Generous Group helps Track trends and variances – against target, budget and prior periods.Surface warnings and exceptions – so issues are easier to identify early.Connect related measures – so management can understand what may be driving the change.Dashboards designed for decisions, not just presentation. Related Dashboard & Analytics Solutions Financial DashboardsOperational DashboardsCommercial Finance DashboardsCommercial Performance DashboardsWorkforce Analytics DashboardsSales Performance DashboardsExample Workforce Performance Dashboard Discuss Your Dashboard & Analytics Needs